Introduction
CLEEN Foundation, with
the support from the Macarthur Foundation, has been conducting Crime
Victimization Surveys in Nigeria since 2005. Victimization surveys have emerged as
extremely efficient method of gaining insight into the trends of crime and
safety in a society. In Nigeria, the
primary aim of the Crime Victimization Survey is first and foremost to
understand the trends and changes in crime in Nigeria. It also enables us to guage the perceptions of
Nigerians on three basic questions:
a) How safe do they feel
in their community?
b) What is their actual
experience of crime?; and
c) What is their
perception of crime prevention efforts in their community?
Understanding that
safety in a community exceeds the mere absence of crime, our survey methodology
was designed to cover the individual, the public and the social architecture
for safety and crime prevention. For
this reason, we cover topics such as road traffic safety, perceptions on
corruption, and criminal justice administration.
This presentation highlights
key findings of the 2013 Crime Victimization Survey using data collected from
fieldwork conducted in June and July 2013. Overall, these findings are meant to assist
the government, police and the entire criminal justice administration system to
better understand emerging trends in crime and safety in Nigeria and
consequently, to refine and deploy improved strategies to resolve the country’s
current challenges of security and safety. It will also be found that in many instances,
we provide a trend analysis of the findings over the last 3 years. We also break down the findings across states
and geopolitical zones, and also highlight the national averages.
Section One: Population, Sampling and Method
This study employed
survey research methodology and is designed to ensure that its findings
adequately reflect the perceptions of Nigerians. The population sample consisted of 11,518
Nigerians equally distributed among male and female adults aged 18 years and
above from all the 36 States in the country and the Federal Capital Territory. The data collection method employed was the
household survey involving face-to-face personal interviews. Respondents were selected through a stratified
multi-stage random sampling procedure in order to achieve a representative
sample. Respondents must have lived in
the selected household for a period of not less than six months.
The fieldwork for the
survey was conducted by Practical Sampling International (PSI), a reputed
research company with a wide experience in quantitative research in the
country. CLEEN Foundation employed
monitors to observe the conduct of the field work as an initial quality control
measure. The data processing was done in collaboration with DC Pro-Data Consult Limited
with supervision by the CLEEN Foundation research team. Data entry, cleaning and analysis was done
using Statistical Package for Social Sciences (SPSS).
Section Two: Survey Findings
The general findings
of the 2013 Crime Victimization and Safety Survey in the areas of fear of
crime, safety, victimization pattern and trend, corruption trend, road safety,
and performance of the entire criminal justice system are presented below. A comparative analysis of results of previous
surveys is also made to determine the dynamics in crime over time.
1. Fear of Crime
Fear of crime refers
to the fear of becoming a victim of crime. The findings of the 2013 survey indicated that
more than 7 out of 10 Nigerians 72% had the fear of becoming victims of crime. Across States, Ogun and Ondo State recorded
the highest with 94%, while Benue and Taraba State recorded the lowest with 38%.
The national average stood at 72%. Analysing by gender, 73% of females feared
becoming victims of crime compared to 71% of males.

Graph 1: Fear of Crime
2. Actual Experience of Crime
A distinction must be
made between the perception, and the actual experience, of crime. In the dataset, as much as a quarter of respondents,
that is 25%, said that they had been victims of crime during the past year. The findings showed a progressive decrease in the
number of victims of crime in Nigeria. There
has been a 6% decrease in actual experience of crime from the 31% recorded in
2012 to the current 25%. The survey also
indicated that the number of victims of crime was highest in Enugu State with 70%,
followed by Ekiti and Ebonyi State (both 65%). The national average was 25%. Katsina State had 9%, while Ogun had the
lowest score of 5%. Analysing experience
of crime by regions in Nigeria, the South East recorded highest with 44% while the
North West recorded lowest score of 18%. Lagos State also recorded 18%. Further desegregation by gender indicates that
more men (27%) had actual experience than women (23%).

Graph 2: Actual
Experience of Crime
3. Trends Analysis of Criminal Victimization in Nigeria
i. Robbery
Experience of robbery
has increased from 17% in 2012 to 18% in 2013. When disaggregated by States, the results of
the 2013 survey showed that Kaduna State recorded the highest of 43%, followed
by Akwa-Ibom State (42%) and Cross River State (39%), while Jigawa (5%) and
Kano (3%) were among the states with the lowest incidence of robbery. The survey also revealed that security in the
home remains a key challenge, as 37% of robberies occurred in the homes of respondents;
another 26% occurred near the home, while 9% took place in the workplace or
school.

Graph 3: Robbery by
State
ii. Rape and Attempted Rape
5% of respondents stated
that they had been raped or been victims of attempted rape. The analysis according to geopolitical zones
shows that the South South has the highest incidence with 10%, followed by the
North East (6%). The South West and
North West recorded 4% each. The North
Central recorded 3% and South East had the lowest score of 1%. The incidence of rape has been on the increase
from 3% in 2011 to 5% in 2013. When
victims were asked where the rape occurred, 36% said it happened near their own
homes; 19% said it occurred at their homes and 13% said it occurred in the
school or work place. Again the
challenge of security and safety in the homes is explicitly exhibited in rape
case. Respondents were further asked how
widespread the incidence of rape was: 10% believed it was very widespread, 33% said
it happened occasionally, 48% believed it was non-existent while 9% said they
do not know.

Graph 4: Rape /
Attempted Rape
iii. Kidnapping and Attempted Kidnapping
A total of 3% of the
respondents interviewed nationwide said that they had been victims of
kidnapping or attempted kidnapping. The
South West had the highest incidence of kidnapping with 5%, followed by the South
East and South South with 4% each. The North
West and North East each had an incidence of 3%, with the lowest being North Central
at 2%.

Graph 5: Kidnapping /
Attempted Kidnapping
iv. Physical Assault
33% of respondents said
they had been victim of physical assault in the 2013 survey. Some states, Enugu
(84%), Ebonyi (77%), Rivers (58%), and Anambra (50%) recorded a high incidence
of physical assault compared to other states such as Ogun (38%), Taraba (36%), Lagos
(35%) and Kogi (34%). The FCT recorded
an increase from 15% in 2012 to 24% in 2013. Some states such as Kano recorded a decrease
from 14% in 2012 to 3% in 2013. In Niger
State, physical assault fell from 68% in 2012 to 6% in 2013; and in Jigawa
State, it fell from 23% in 2012 to 8% in 2013.

Graph 6: Physical
Assault by State
v. Domestic Violence
Nearly one in every
three respondents (30%) admitted having been a victim of domestic violence. Over the last 3 years, there has been an
increase in domestic violence. There was
a progressive increment from 21% in 2011 to 31% in 2012 with a 1% decrease in the
2013 survey to 30%. The findings of the
2013 survey revealed that domestic violence ranks amongst the top four most common
victimizations in Nigeria. Prevalence is
highest in the South East with 43% followed by the South West and the North
East with 35% each. The South-South recorded
a 26% incidence while the North Central and North West recorded the lowest with
19% each.
vi. Attempted Murder
5% of respondents stated
that they were victims of attempted murder. This indicated an increase from the 3%
recorded in 2012. The highest was in the
North East (8%), followed by the South South and North West with 7% each, the South
West (6%), North Central (3%) and South East (2%) had the lowest incidence in
this analysis.

Graph 7 (i): Attempted
Murder
Further analysis of the 5% who responded that they were victims of
attempted murder in 2013, showed that 35% of them said that the incidents occurred
at their own homes.

Graph 7 (ii) Location
of Attempted Murder
vii. Theft of Mobile Phone
Over all, nearly one
in every two respondents, that is 45%, reported being a victim of theft of
mobile phone. Theft of mobile phones remains
the number one crime committed in Nigeria. At the State level, Taraba ranks highest at 64%, followed by Kwara, Abia, Lagos, at 59%, 57%, 55% respectively,
while Kaduna, Ekiti, Nasarawa and Plateau all had scores of 54% each. Lowest ranking were Ogun and Yobe with 23% and
22% respectively.

Graph 8: Theft of Mobile Phones
viii. Car Theft
The Survey revealed
that 4% of respondents have had
their cars stolen in the past one year. The
highest incidence of car theft occurred in the North West (6%), followed by the
South South (5%). The North East and South
West recorded 4% and 3% respectively, while the South East and North Central
recorded 2% and 1% respectively. 35% of
cars were stolen in victims’ homes, 34% near victims’ homes, 19% elsewhere and
12% at their work place or school.

Graph 9(i) Car Theft

Graph 9(ii) Location
where Car Theft Occurs
xi. Armed Violence other than Robbery
Armed violence entails
the use of weapons and physical force to inflict, or attempt to inflict
injuries on another. The results of the
survey indicated that 4% of respondents were victims of armed violence. The highest incidence was in the North East
with 11%, followed by the South South with 9%.
For the other regions, the North Central and North West recorded 3%
while the South West and South East recorded 1%.

Graph 10(i) Armed
Violence by Region
The survey further
indicated that 42% of armed violence occurred near the home, 14% at home and 7%
at work or school. 5% males have been victims of armed violence and 4% females
have been victims of this type of crime in Nigeria.

Graph 10(ii) Armed
Violence by location
4. Service Delivery of
Agencies
i. Reporting
of Crime to the Police
The findings of the
survey revealed that most crimes – 82% – are unreported. Only 2 in 10 (18%) of respondents who suffered crimes
reported to the police. Further analysis
by States shows that the lowest percentage of reports were made in Yobe (6%), Osun
and Zamfara (7% each), Ebonyi (8%), Kaduna (8%), and Anambra (10%). The highest percentage of reports were made in
Edo (45%), Niger (41%), Kogi (34%), Ogun and Kebbi (29%) respectively.

Graph 11: Reporting to
Police by State
ii. Satisfaction with Police Handling of
Cases
Of those who made
reports to the police, when asked about their satisfaction with the way the police
had handled their cases, less than half of them (46%) were satisfied while 39% were
not satisfied, with 15% undecided. The
46% threshold of victims’ satisfaction however is a decrease from the 48%
recorded in 2012. Key reasons given for dissatisfaction
by complainants include police ineffectiveness (76%), inadequate feedback (9%),
bribery and corruption (9%), and police insensitivity (5%).
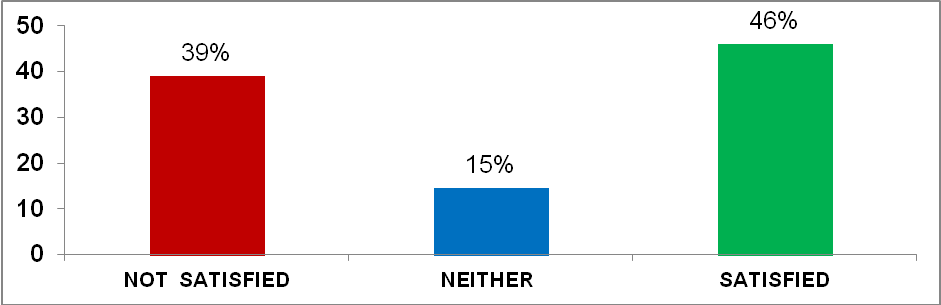
Graph 12: Satisfaction
Rating of Police Handling of Complaints
iii. Support
for the Removal of Police Check Point
When asked to assess
the Inspector General of Police's directives on the removal of police check
points on the roads, 45% of respondents supported the removal of police check
points on roads while 43% said they opposed it. 12% said they neither supported nor opposed
it.

Graph 13: Support for
the removal of road blocks by Nigerians
iv: Quality of Policing in Nigeria:
59% of the respondents, which is nearly
6 out of 10 Nigerians, were of the opinion that the police is doing a good job,
while 32% believe the police is doing a poor job. 19% were undecided. There has been an improvement in the quality
of policing in the country with positive ratings rising from 50% in 2012 to the
current 59%.

Graph 14: Quality of
Policing in Nigeria
v. Satisfaction with Police Performance
in Controlling Terrorism or Bombings
Just a little less
than half of respondents (49%) interviewed said they were satisfied with the performance
of the police in controlling terrorism or bomb attacks in the country. 32% said they were dissatisfied while 17% said
they were neither satisfied nor dissatisfied and 2% said they do not know.

Graph 15: Satisfaction
with Police Handling of Terrorism/Bomb Attacks
52% of respondents
said they were satisfied with the way the Federal Government is handling the
issue of terrorism or bomb attacks; 30% were dissatisfied, 16% said they were
neither satisfied nor dissatisfied and 2% said they do not know.

Graph 16 (i): Federal
Government Handling of Terrorism and Bombing Attacks
v. Solving the Problem of Terrorism
A majority of the
respondents (52%) suggested that the Federal Government should strengthen the
capacity of the security agencies or use force to solve the problem caused by
insurgents, 31% were of the view that dialogue will solve the problem of terrorism
in the country, while 20% believed that the combined use of force and dialogue
will solve the problem, and 10% suggested that appeasement with money will
solve the problem.

Graph 16 (ii)
Suggested Solutions to the FG on Handling of Problems of Terrorism
4: Others
i. Demands for Bribes by Government
Officials.
The findings of the
survey indicated that levels of bribery and corruption among government
officials in Nigeria remain high. Nearly
1 out of every 4 respondents (24%) admitted having paid a bribe or having been asked
to pay bribes by government officials before services could be rendered to
them. This is the same as the 24% result
for 2012.
The 2013 survey also showed that bribery and corruption among
public officials such as police, customs officers, court personnel, tax
officials, anti-corruption agencies and PHCN employees were higher in Rivers with
48%, Borno (47%), Cross-River and Niger (both 44%), Gombe (40%), Ebonyi (39%),
Ekiti and Anambra (both 37%) and Kwara, with 36%. These states have incidences far above the
national average of 24%. The lowest incidences were recorded in Katsina (7%)
Ogun (6%) and Akwa-Ibom (5%) States.

Graph 17: Demands for
Bribes by Government Officials by State
Among the public
officials who demanded for bribes, the Police (33%), Immigration (26%), Independent
Corrupt Practices Commission (25%), Custom (24%), and NEPA/PHCN officials (23%)
were the highest.

Graph 17(i) Propensity
of Government Agencies to bribery
ii. Constraints
against Anti Corruption Agencies
The respondents also
identified some major constraints militating against the effectiveness of anti-corruption
agencies in Nigeria. These include
Government insincerity (37%), lack of funds and facilities (32%), corruption of
the EFCC and ICPC officials (20%), and weak and corrupt judiciary (11%).

Graph 18: Reasons for the
ineffectiveness of anti-corruption measures
iii. Ownership of Firearms or guns
At the national level,
2% of respondents admitted owning firearms or guns, with the highest levels in the
South East and North East (both 3%). This represented a decrease from the 5% recorded
at the national level in the 2012 survey. Half (50%) the people who owned guns use them
for personal protection.

Graph 19: Ownership of
Guns across geopolitical zones
For more information
about the National Crime and Safety Victimization Survey in Nigeria please
visit www.cleen.org or send an email to
cleen@cleen.org.
* Presented by 'Kemi Okenyodo,
Executive Director CLEEN Foundation, a non-governmental organisation which aims
to promote public safety, security and accessible justice in Nigeria and West
Africa.
2 comments:
So the #1 crime committed in Nigeria is "just" mobile phone theft? That's very interesting. Perhaps this reflects the frequency and spread of its occurrence.
In my opinion, the most annoying and infuriating corrupt practice of all is by Customs and Immigration officials, followed closely by Road Safety (traffic police). These people go straight under my skin whenever they strike!
The illuminati brotherhood is a secret society of wealthy and influential people all around the world And we have representatives every where, even in you country. Anybody in any part of the world of any religion can be a full member of the illuminati brotherhood as long as you can complete the Molanter of genesis initiation process and become a full member of the fraternity then you will see the power of wealth and fame and famous rich $920,000. instantly you become a full member of the illuminati brotherhood. The Molanter initiation process will take just 3 days, and we are not against any religion or any country law. Immediately your initiation is completed you will see the power of the fraternity in your life contact via +234708 264 4268 email Williamilluminati293@gmail.com
Post a Comment